

llmfit Hands-On: Find the Right Local Models for Your Mac
I tested llmfit 1.1.12 on my base-model Apple M4 Mac mini—the 16GB 'poverty spec'—covering hardware detection, Score and tok/s sorting, model details, and community benchmark sharing.
Introduction
I’ll be starting military service on September 16, so updates here will pause for a while. Our bathroom renovation has already slowed my posting schedule recently. While I still have time to write, I’m testing llmfit on my base-model Apple M4 Mac mini—the 16GB model people jokingly call the “poverty spec.”
llmfit detects your computer’s CPU, RAM, GPU, available memory, and local inference backends, then ranks models in a table based on how well they fit the hardware.
I installed llmfit 1.1.12. On startup, it detected the M4, available RAM, GPU-accessible memory, and the local MLX and llama.cpp backends. This time, the list contained 9,590 candidate models. The 15.22-second video I recorded shows only three things: pressing s to change the sort key, selecting a model with the arrow keys, and pressing Enter to open its details.
What Problem Does llmfit Solve?
The most frustrating part of running local models often isn’t downloading them. It’s not knowing whether your computer can handle them before you download them. Model names include parameter counts, quantization formats, and different variants, but a Hugging Face page alone doesn’t make it easy to estimate memory usage or performance on a specific machine.
llmfit combines the detected hardware information with model data to calculate a rating based mainly on four factors: whether the model fits the hardware, estimated speed, model quality, and context. The main table also shows parameter count, recommended quantization, disk space, GPU or CPU execution mode, estimated memory usage, use case, and Fit rating.
It gives you a starting point for filtering models, not a guarantee. The tok/s* column includes an asterisk because the speeds shown here are estimates. Actual performance still depends on the inference backend, context size, quantization method, and the computer’s current workload.
Installing on macOS, Linux, and Windows
For macOS and Linux, start with the Install section in the official README, or check GitHub Releases for the current version. The officially recommended precompiled Homebrew package can be installed with:
brew install AlexsJones/llmfit/llmfit
On Windows, you can install it through Scoop:
scoop install llmfit
If you don’t have Scoop yet, follow the instructions on the official Scoop website first. You can also download the Windows build directly from llmfit Releases.
After installation, you can check the version with the same command on all three platforms:
llmfit --version
To start it normally, just run llmfit. It automatically launches the Web Dashboard in the background. I only wanted to record the terminal interface this time, so I used:
llmfit --no-dashboard
This option disables the default Dashboard and prevents the service from starting on 0.0.0.0:8787. It also keeps the screen cleaner when recording a terminal-only demo.
Check the Hardware and Inference Backends First
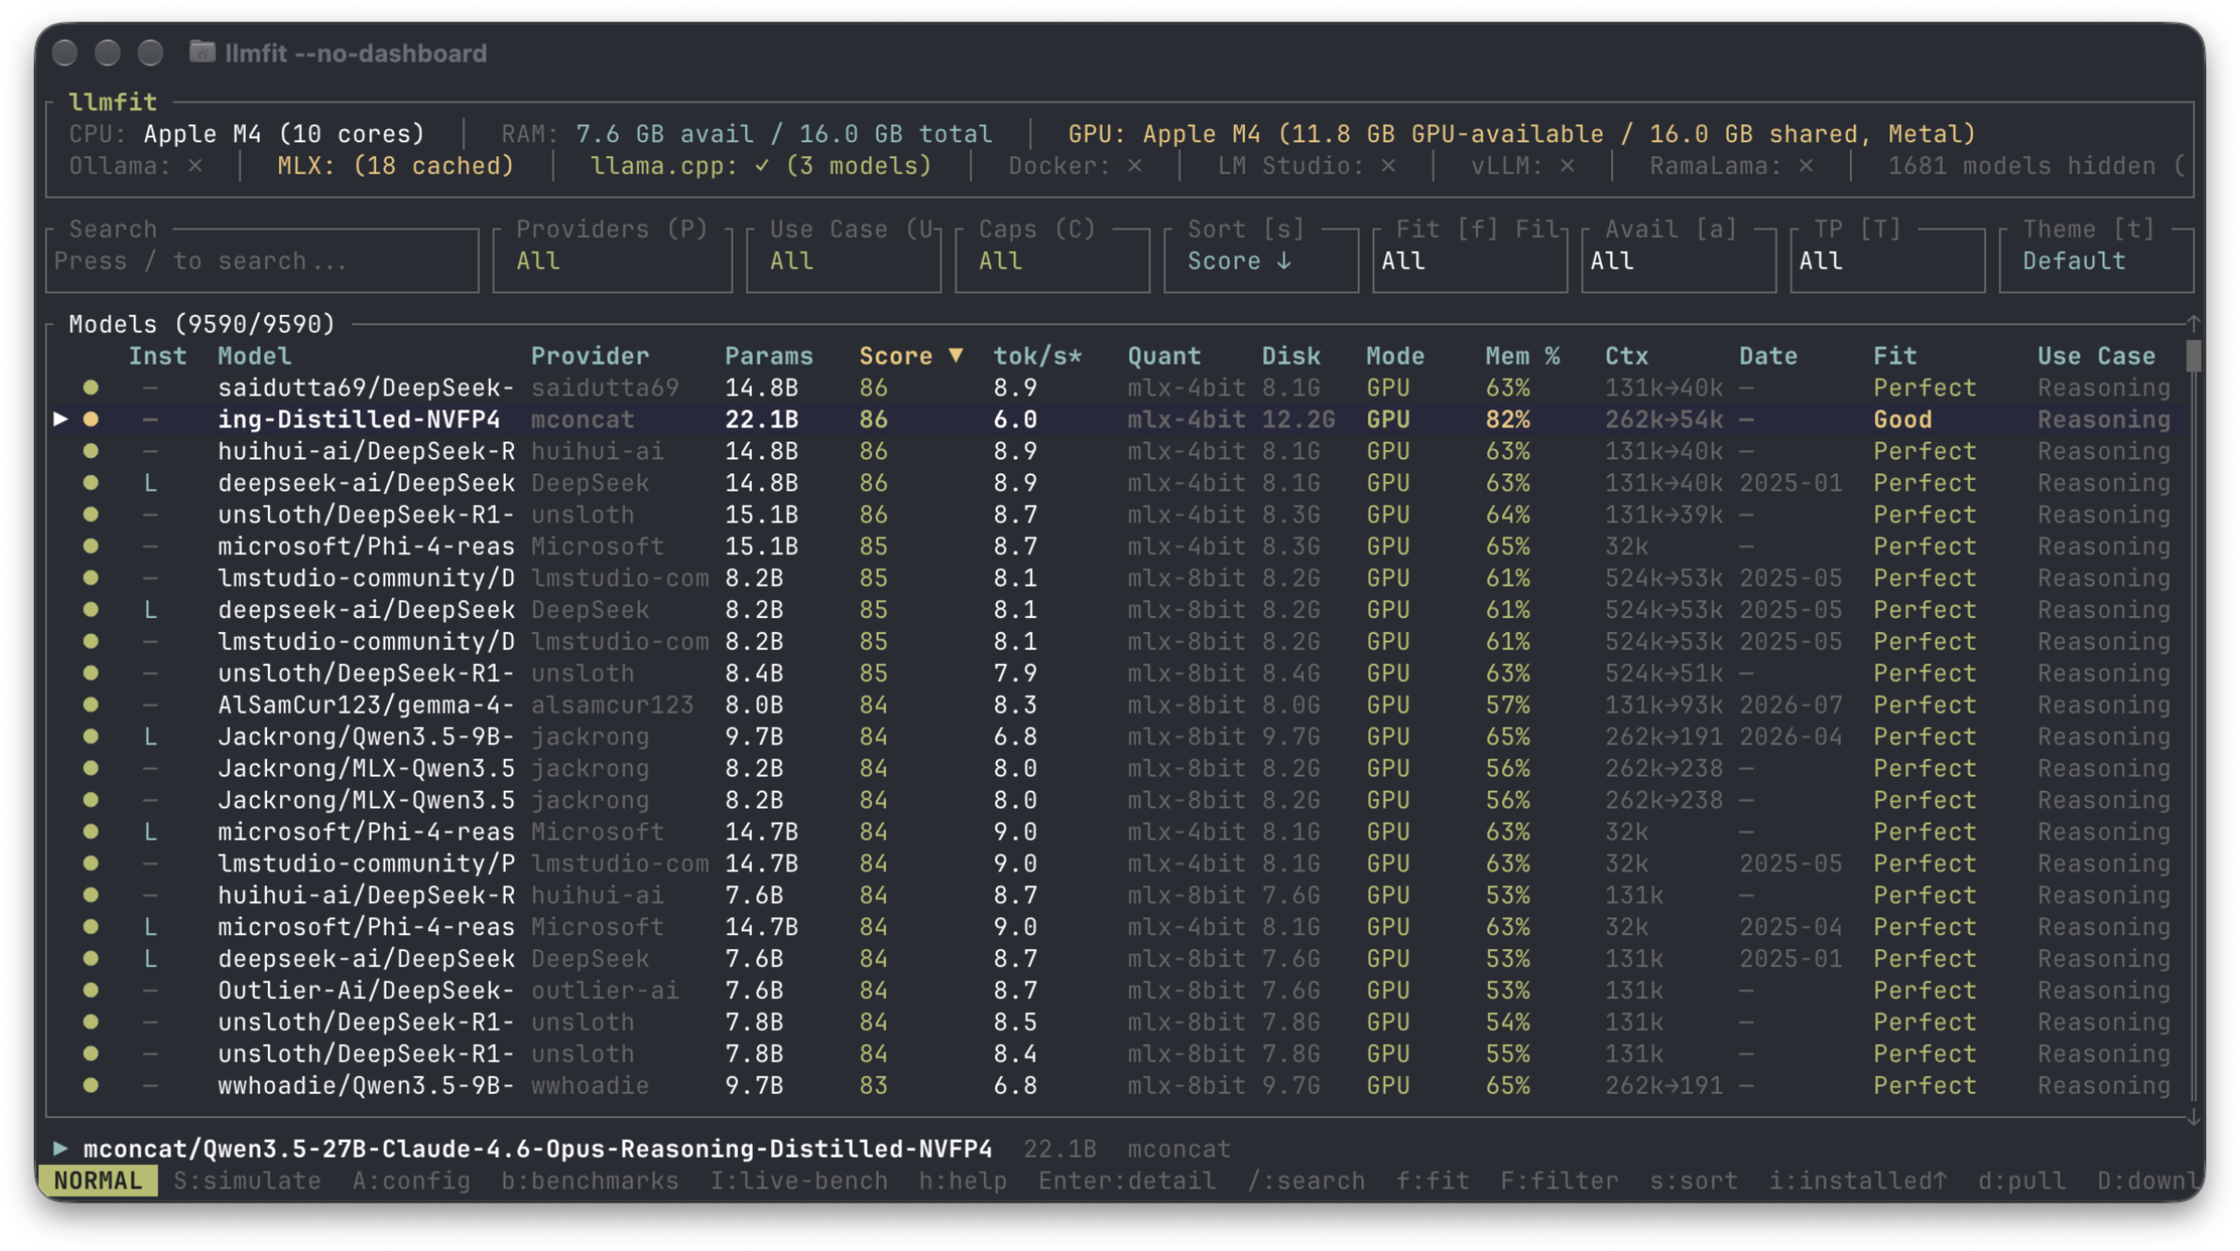
Hardware and inference backends appear at the top, while the model list below is sorted by overall Score by default
The hardware appears at the top of the main screen. This time, llmfit detected a 10-core Apple M4, 16GB of unified memory, and about 11.8GB of GPU-accessible memory. The next row shows whether backends such as Ollama, MLX, llama.cpp, Docker, LM Studio, vLLM, and RamaLama have been detected.
Each row below represents a model. These are the fields worth checking first:
Score: An overall rating based on quality, speed, Fit, and context.tok/s*: The estimated number of output tokens per second. The asterisk indicates an estimate.Quant: The quantization format llmfit recommends for this hardware.Mem %: The estimated percentage of available memory the model will use.Ctx: The model’s context size and the estimated usable range on this hardware.Fit: A hardware fit rating such as Perfect, Good, or Marginal.Use Case: Intended uses such as Reasoning, General, or Embedding.
Perfect refers to the hardware fit. It doesn’t mean the model will necessarily produce the best answers. You still need to consider the Score, use case, and license together.
Press s to Change the Sort Key
I originally considered describing this action in the video as “switch Select,” but “change the sort key” is more accurate. In English, you could say cycle through sort options or switch the sort key.
In the 1.1.12 version I installed, pressing lowercase s in Normal mode cycles between sort fields such as Score, tok/s, and Provider. This is separate from Select mode, which uses uppercase V, so don’t mix up the two.
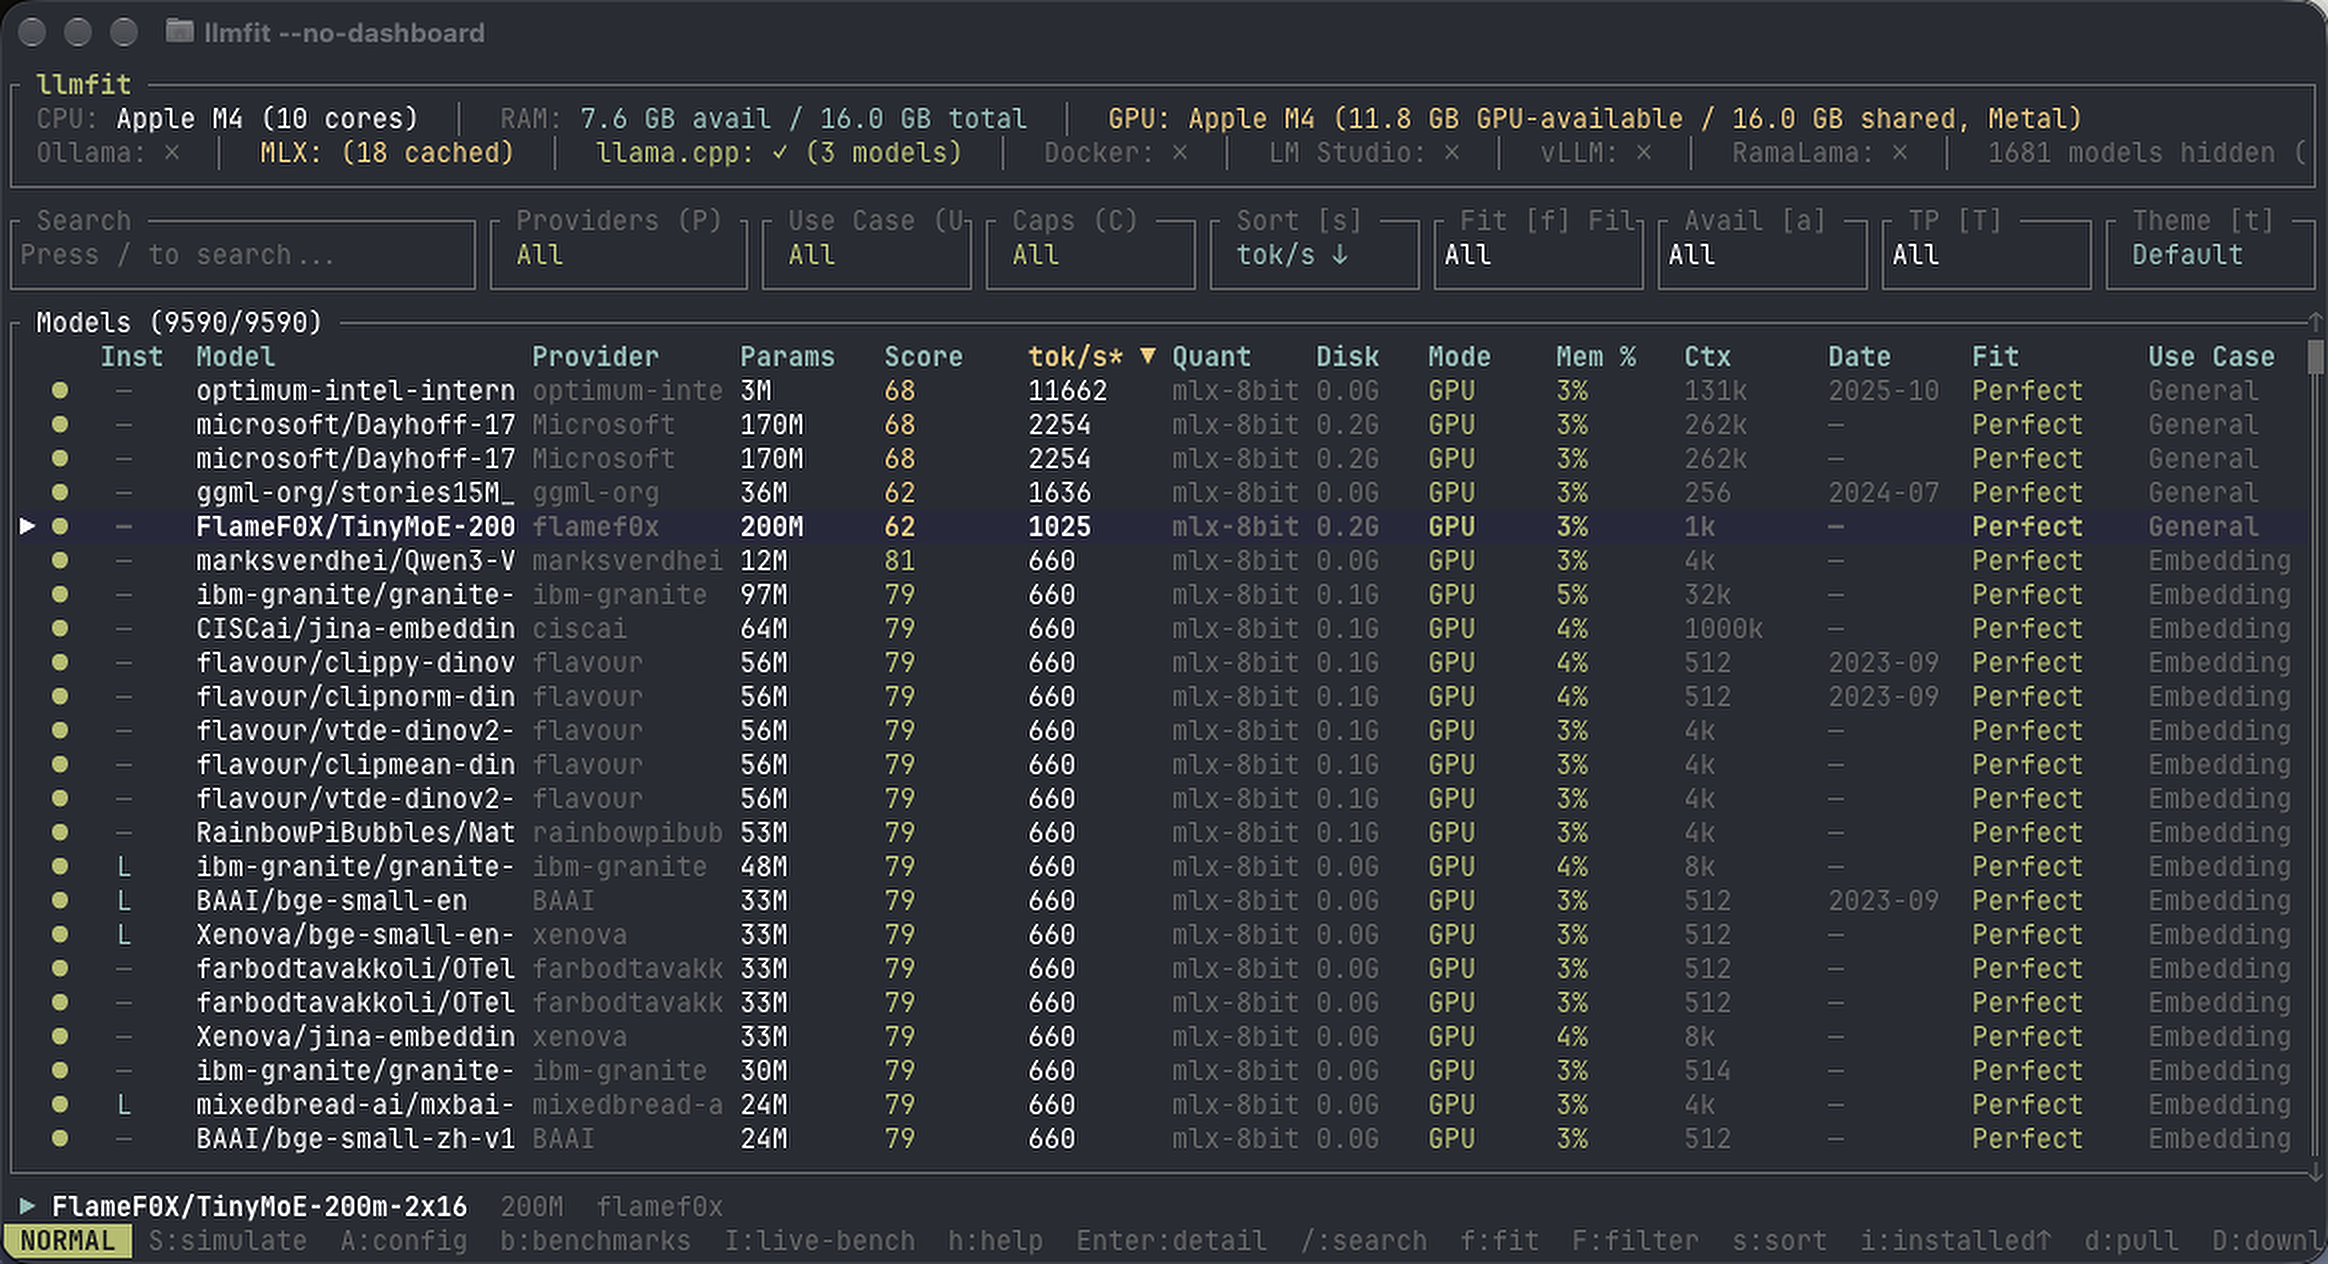
Press `s` to sort by tok/s, bringing faster small models and specialized models to the top
Sorting by Score is useful when looking for models that are a good overall fit. Sorting by tok/s lets you focus directly on estimated speed. The difference is obvious in the screenshots: after switching to tok/s, the top results include very small models, Embedding models, and other specialized models. A high number doesn’t mean the model is suitable for general text conversations.
Check the use case before the speed. If you’re looking for Coding, Reasoning, or Embedding models, open the Use Case filter with U and then sort with s. That’s more useful than simply chasing the highest tok/s value.
Select Models with the Arrow Keys or j and k
The basic controls are similar to Vim. You can move the current selection with the up and down arrow keys or with j and k. Pressing Enter switches the table to the detail view.
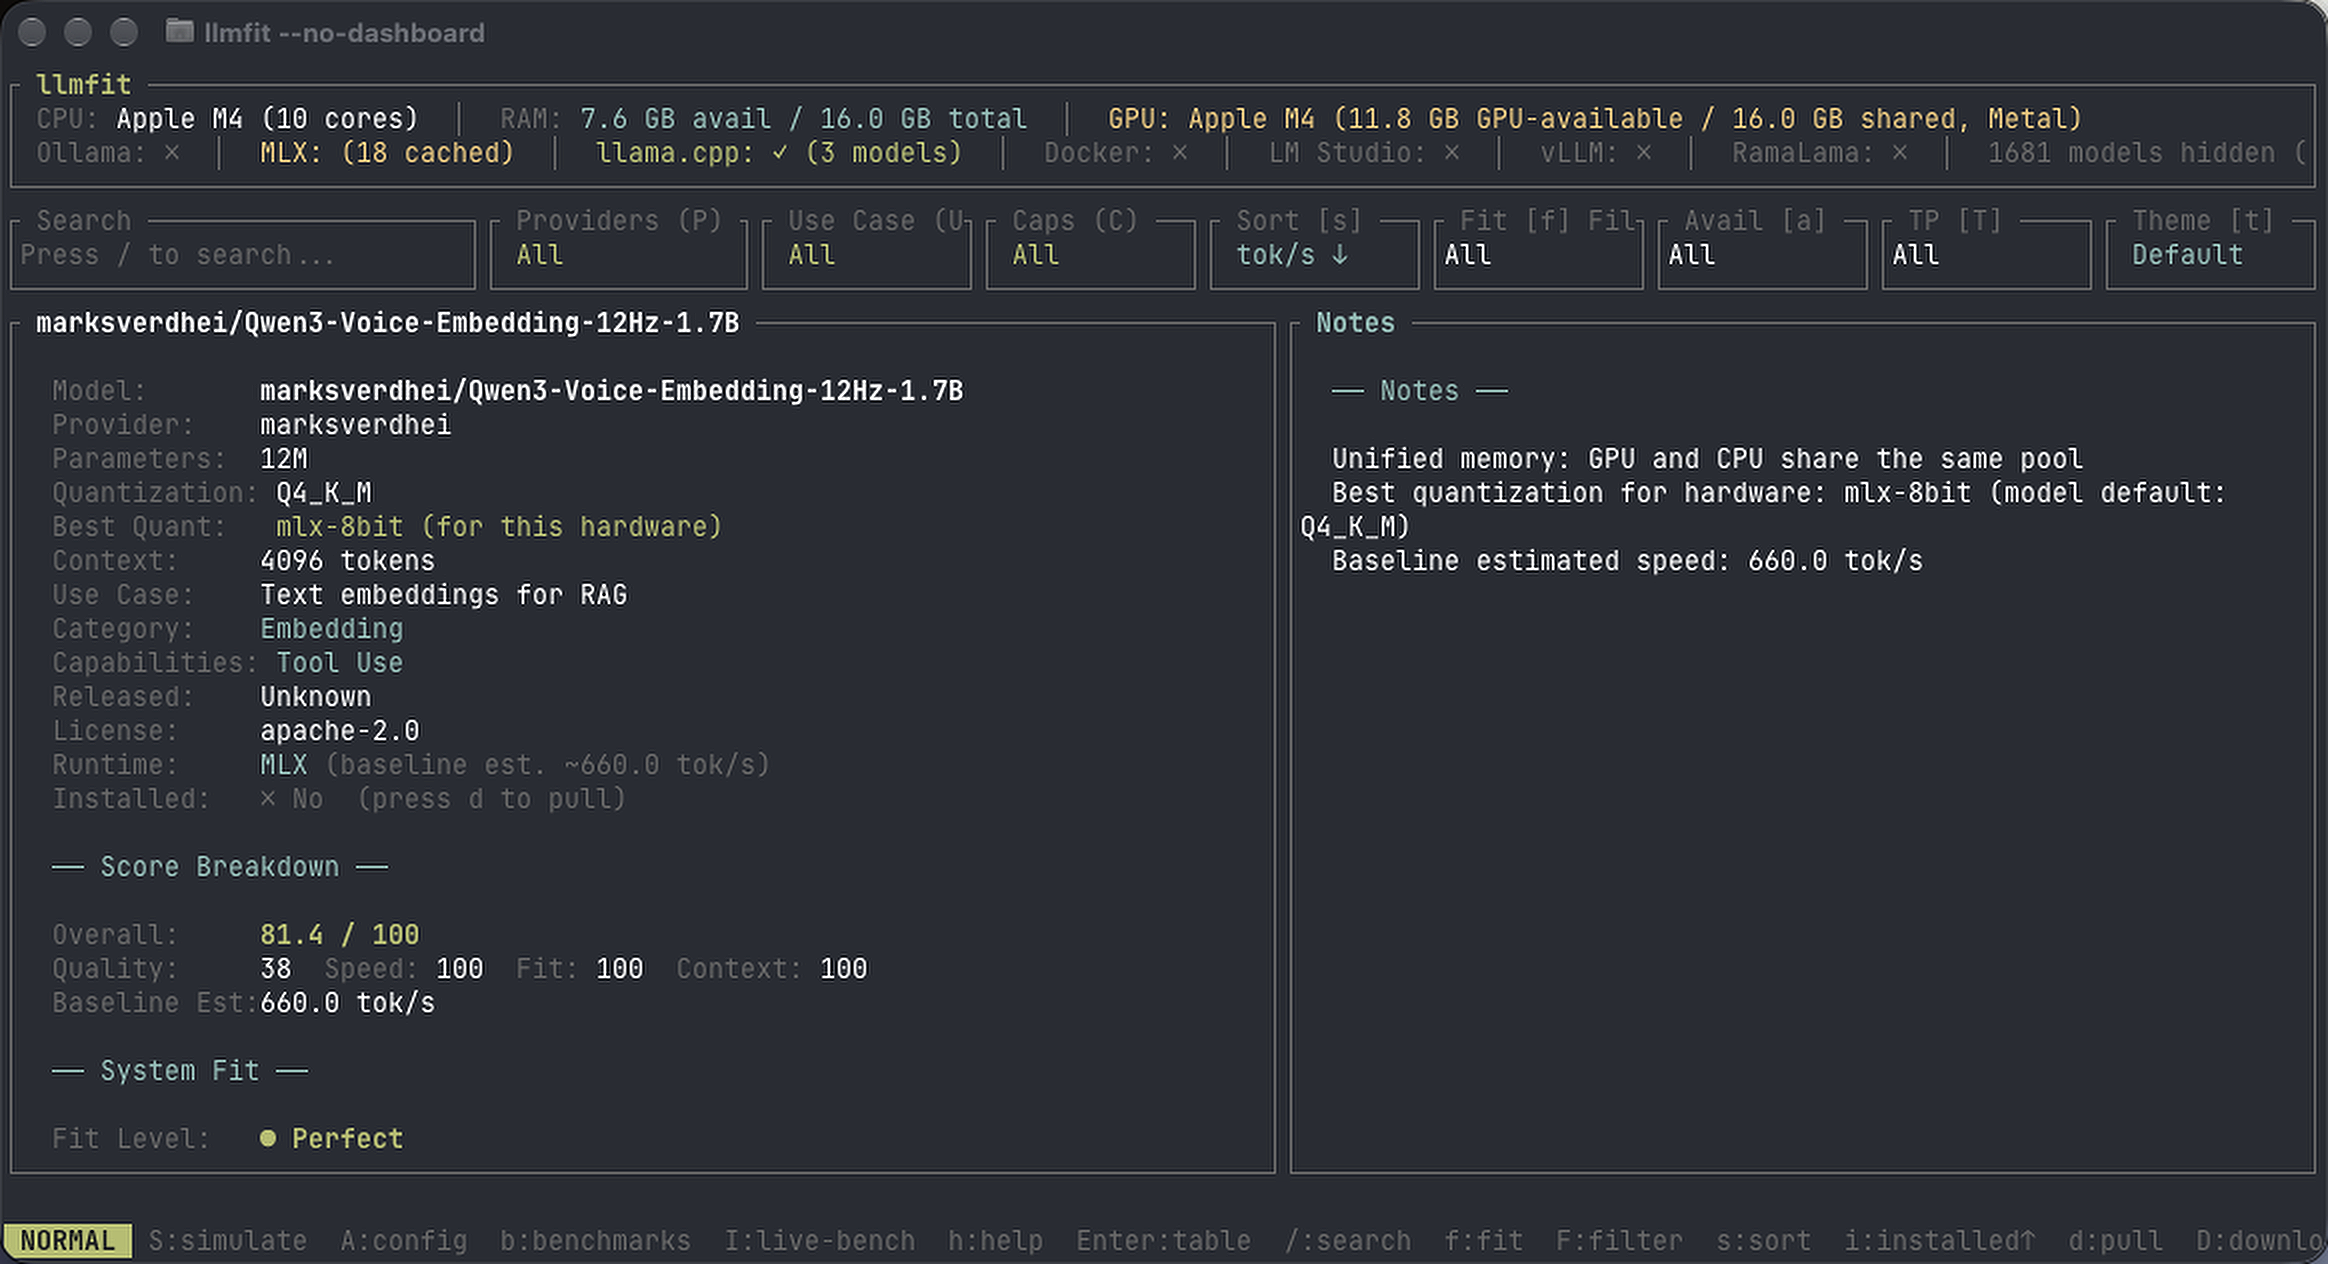
The detail view puts the model requirements, score breakdown, and estimation basis on one screen
The detail view shows the model name, Provider, parameter count, original quantization, the recommended Best Quant for this hardware, context, use case, capabilities, license, and Runtime. The Score Breakdown below separates Quality, Speed, Fit, and Context.
The Notes section on the right is useful. This time, it pointed out that Apple Silicon uses unified memory, meaning the CPU and GPU share the same memory pool. It also listed the recommended mlx-8bit quantization and a 660.0 tok/s baseline estimate. That 660 figure is still an estimate—I did not actually run the model at 660 tokens per second in this video.
Useful Keyboard Shortcuts
| Key | Action |
|---|---|
↑, ↓, or j, k | Move up or down through the model list |
s | Change the sort key |
Enter | Open or close the model detail view |
/ | Search by name, Provider, parameter count, or use case |
f | Cycle through All, Runnable, Perfect, Good, and Marginal |
a | Cycle through all models, models with available GGUF files, and installed models |
U | Filter by Use Case |
P | Filter by Provider |
d | Download the currently selected model |
b | Open the community benchmark leaderboard |
I | Run an Inference Bench on a local model that is currently running |
h | View all keyboard shortcuts |
q | Quit |
Benchmarking and Community Sharing in Recent Versions
My hands-on test focused only on sorting and the detail view. The 1.1.x README also introduces benchmarking, community sharing, hardware simulation, comparison, and download features.
The main recent addition is benchmarking and community sharing. After selecting an installed model with a running inference backend, pressing b first asks whether you want to test it. llmfit runs three real inference tests and measures tok/s and TTFT. The results are stored in ~/.config/llmfit even if you don’t share them, and your own measured results can replace the original estimates in the table.
If you want to send the results back to the community, press Space or s on the benchmark prompt to enable sharing. On this screen, s acts as the sharing toggle. When the benchmark finishes, llmfit uses the GitHub device flow to fork the repository, commit the data, and create a Pull Request automatically. You don’t need to install the gh CLI separately. After the PR is merged, the data will be included in later versions for users with the same hardware.
I didn’t test the other features one by one this time:
- Community Leaderboard: Press
bto view benchmark results from other users and switch between different GPUs. - Inference Bench: Press uppercase
Ito measure TTFT, tok/s, and latency for local models currently running through Ollama, vLLM, MLX, and other backends. - Hardware Simulation: Press uppercase
Sto temporarily change the RAM, VRAM, and CPU core count, then see which models would run under different hardware specs. - Plan mode: Press
pto estimate the RAM, VRAM, and CPU requirements for a specific model. - Compare: Mark models with
mand compare them withc. Visual mode also lets you select several models at once. - Download Manager: Press
dto download a model, or uppercaseDto view progress, history, and settings. - Web Dashboard: It starts automatically when you run
llmfitnormally. Add--no-dashboardif you only need the terminal interface.
Practical Use: Narrow Down the List First
The most immediate use for this workflow is the first round of filtering. Check the hardware, use case, memory requirements, and recommended quantization first. Then compare the Score and estimated speed among models that should run on your machine. At least you won’t download a model that takes up tens of gigabytes only to discover that it isn’t a good fit.
This 15-second video doesn’t run a benchmark, so every tok/s figure marked with an asterisk in this article should be treated as an estimate. If you’re deciding between a few models, the next step is still to launch Ollama, llama.cpp, or MLX and run your own benchmark.