

Stats Review: Put Your Mac's CPU, Memory, and Network Status in the Menu Bar
Stats is a free, open-source macOS menu bar system monitor. I tested its installation, default menu bar layout, and CPU and memory panels for keeping an eye on CPU, RAM, network, and SSD activity.
Introduction
After using a Mac for a while, I often want to know which app is consuming CPU or memory. Activity Monitor can answer that, but it is not a window I keep open all day. What I like about Stats is that it puts the numbers I actually need in the menu bar, while the detailed view is only one click away.
Stats is a free, MIT-licensed, open-source macOS system monitor. CPU, GPU, memory, disk, network, battery, sensors, Bluetooth, and clock modules can all be enabled independently, and you decide which widgets stay in the menu bar. It supports macOS 12 Monterey and later on both Apple Silicon and Intel Macs.
Useful links:
Why I wanted to use it
I do not want to turn my Mac into a dashboard that constantly flashes numbers. I simply want a quick way to check its state when it becomes sluggish, the fans get loud, or network traffic looks unusual.
Stats can show CPU percentage, memory use, SSD activity, or upload and download speed in the menu bar. Clicking a widget opens live charts and a list of demanding processes. In the CPU panel I tested, I could see temperature, utilization, load averages, frequency, and the apps using the most CPU.
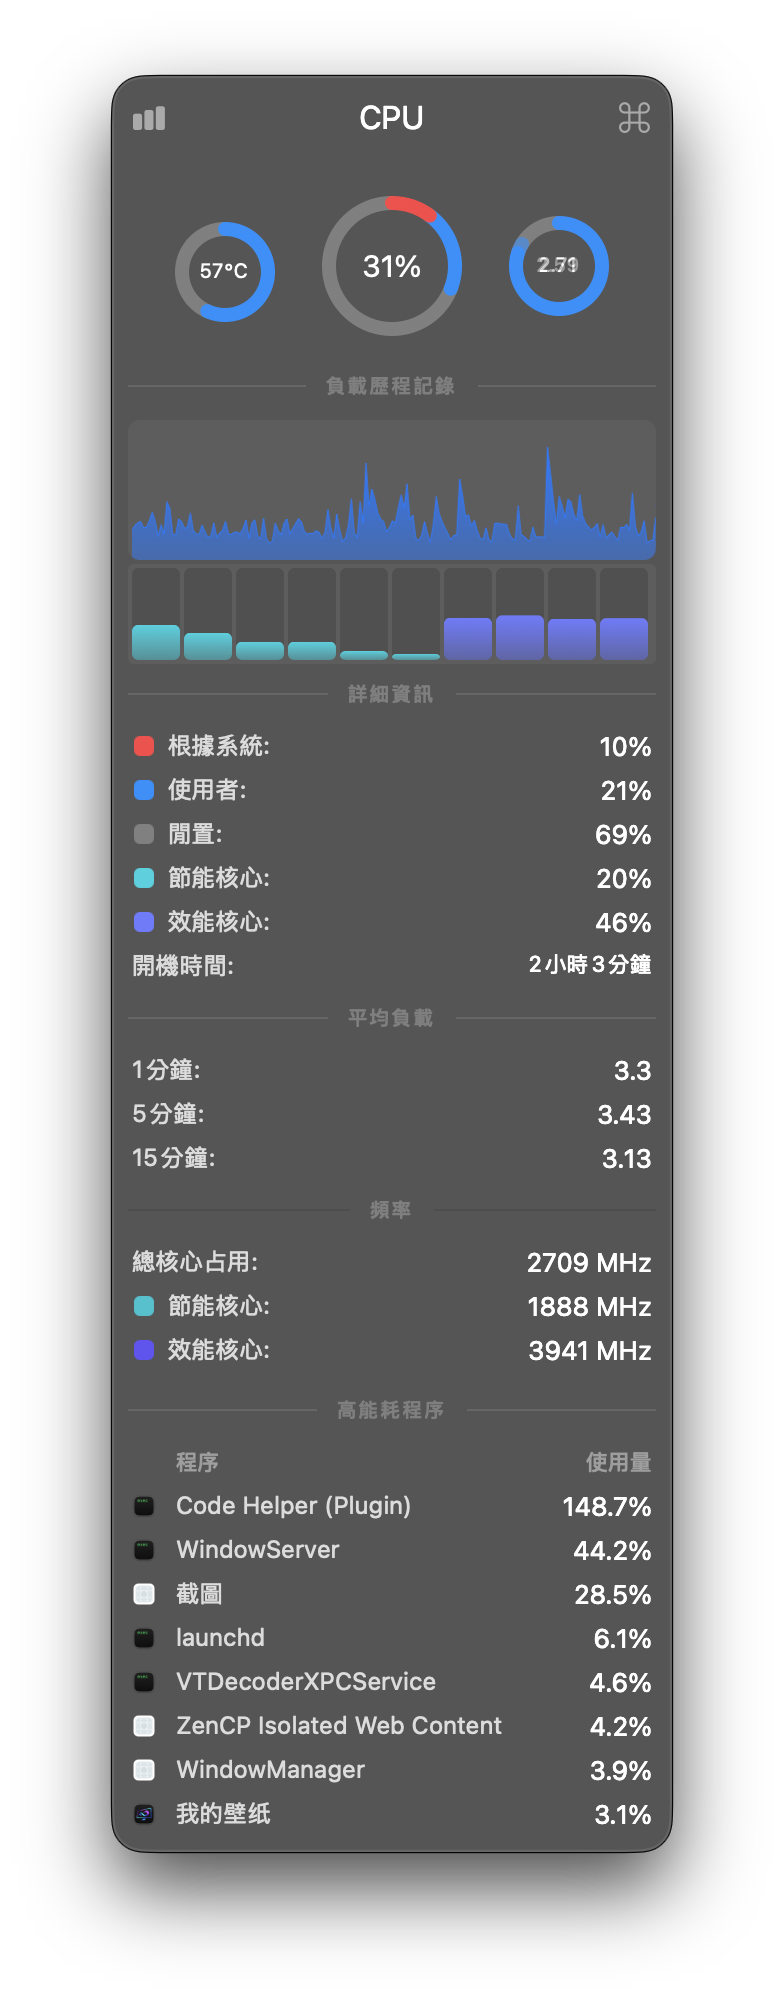
The CPU module makes it easy to identify the process currently using the most resources.
Download and install
The most straightforward option is the Stats download page. Download Stats.dmg, open it, and move Stats to the Applications folder. If you already use Homebrew, install it with:
brew install stats
The DMG follows the standard Mac installation flow: drag Stats from the left to Applications on the right. Launch it from Applications when finished, and it will guide you through choosing a starting preset.
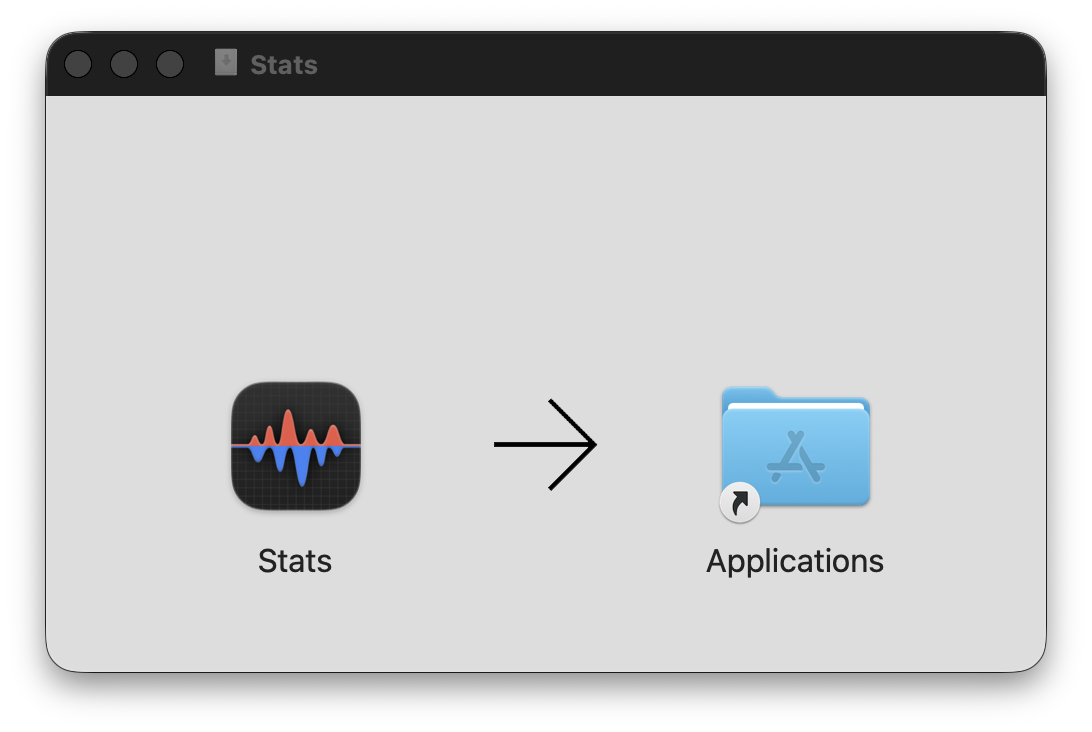
Drag Stats to Applications after downloading the DMG.
First launch: the default preset is enough
On first launch, Stats offers several menu bar presets: Default, Basic, Recommended, and Extended. I would start with Default or Basic instead of enabling every module at once.
The default layout puts CPU, RAM, SSD, and network upload/download activity in the menu bar, which is already enough for everyday use. Add GPU, battery, or Bluetooth later only if you actually need them; every item can be adjusted after setup.
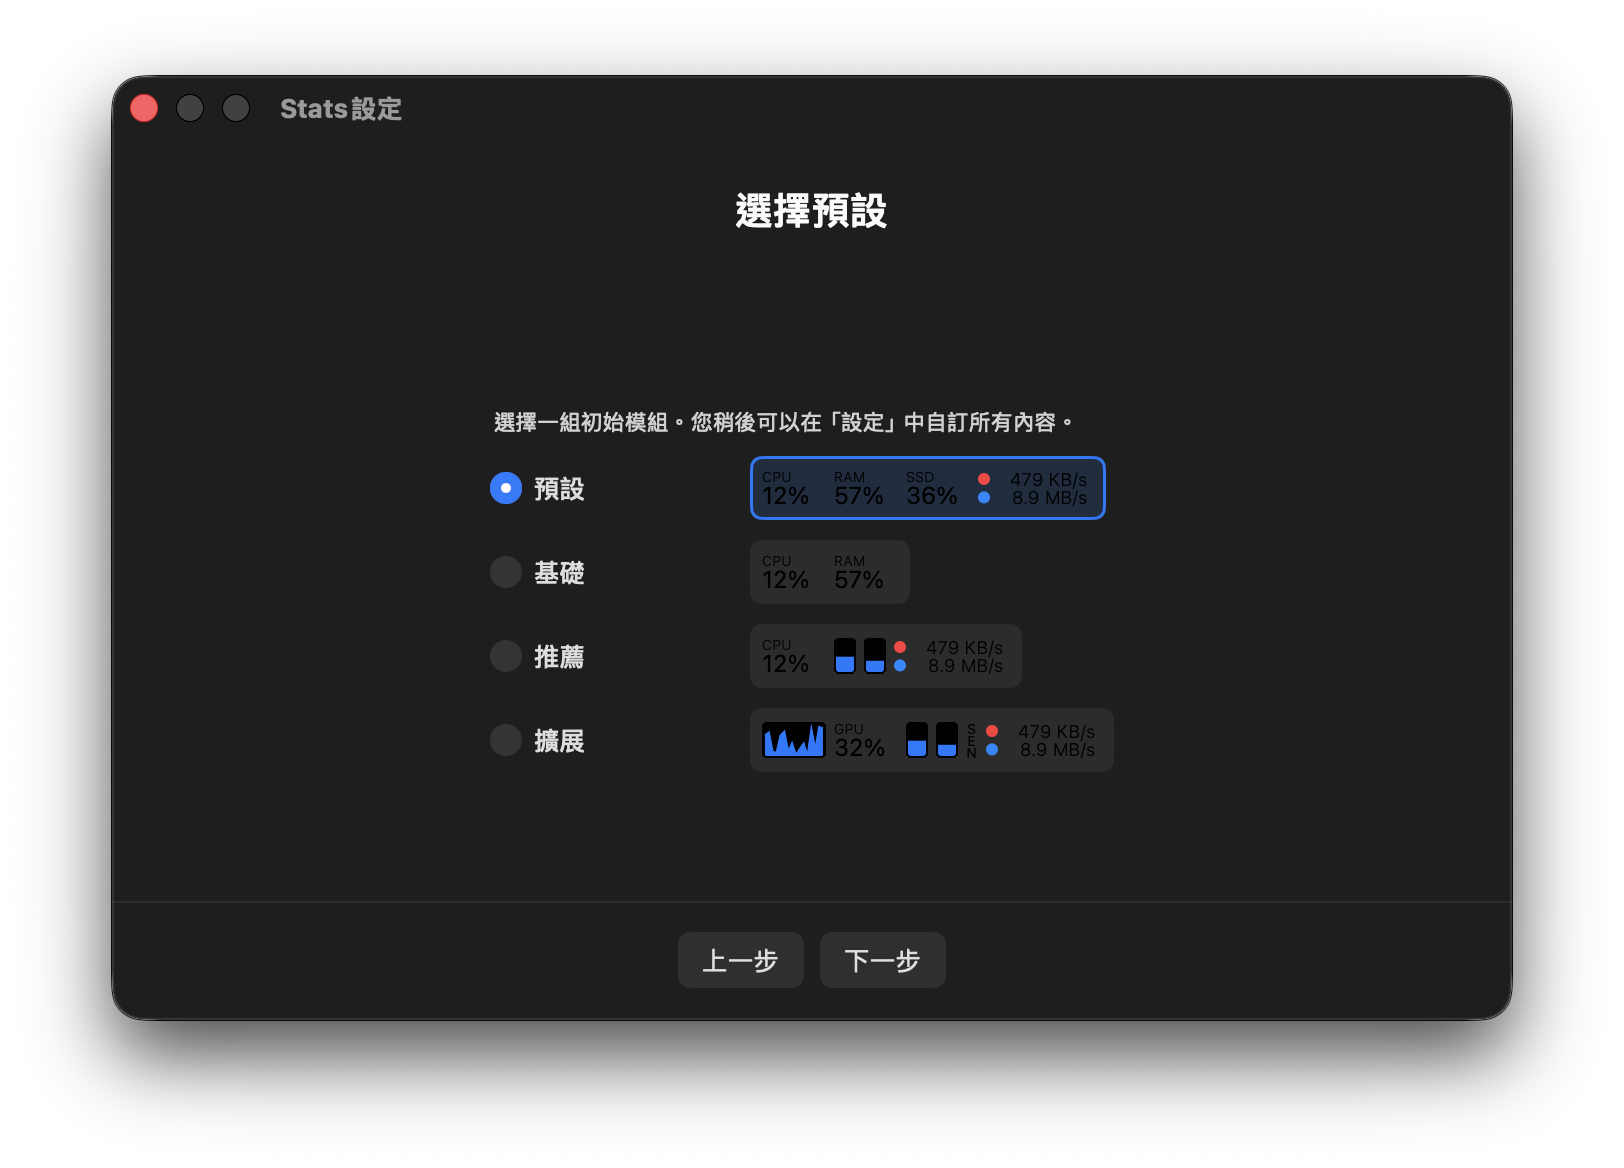
Start with a default layout, then add or remove modules as your workflow requires.
The memory panel is more useful than I expected
The memory panel is the one I open most often. It does not only show how many gigabytes are used: it separates app memory, wired memory, compressed memory, available memory, and swap usage. It also lists the apps using the most RAM below.
That makes it useful for investigating a Mac that merely feels slow. A high used-memory percentage alone does not always mean there is a problem. But if available memory is low, swap keeps rising, and one app remains at the top of the list, I know where to start.
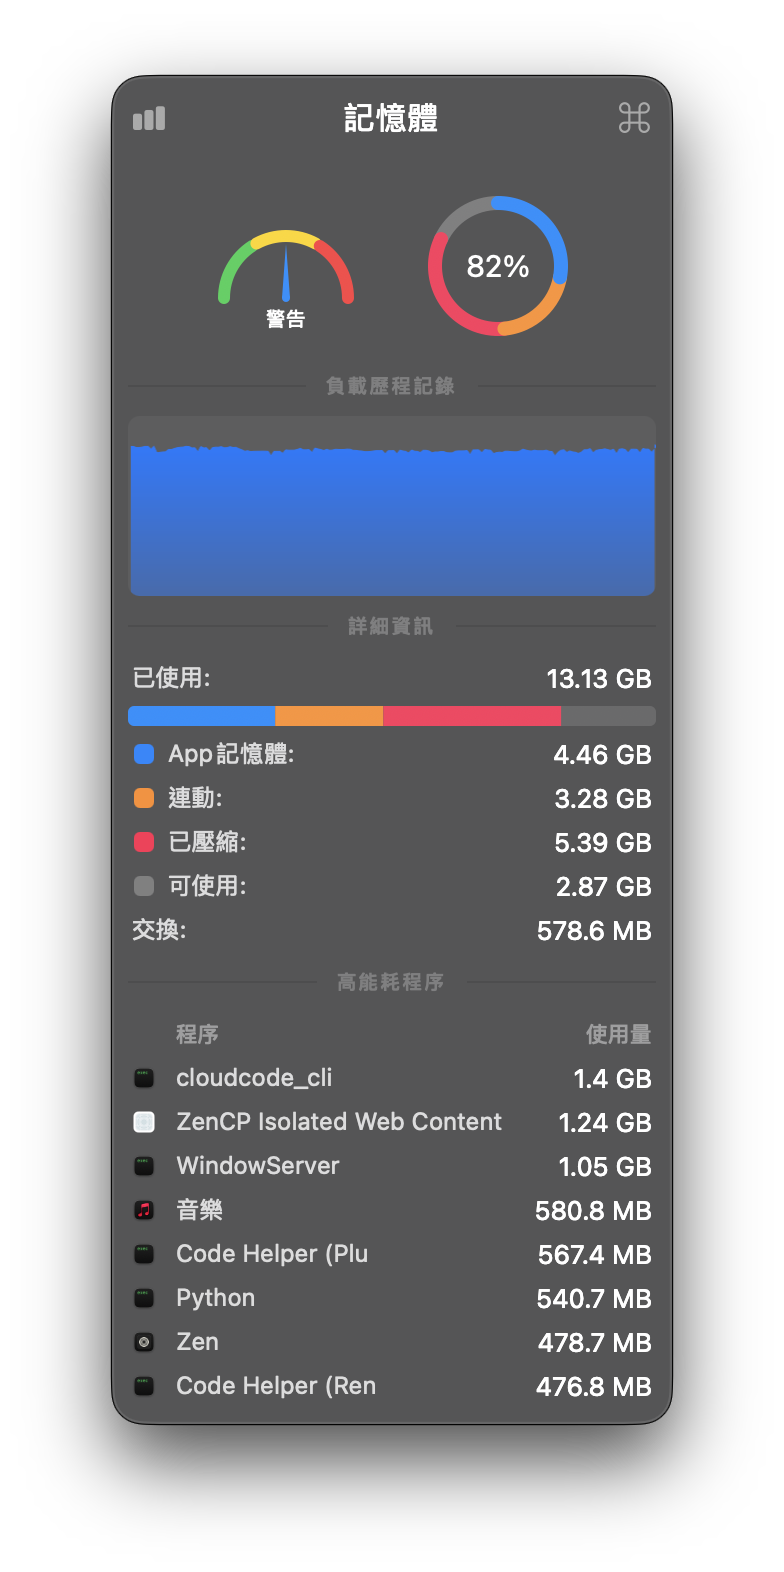
Memory pressure, swap use, and demanding apps are all available in one panel.
How I would configure the menu bar
My rule is simple: keep only the information I will actually use. Too many permanent numbers make the menu bar noisy and can make every small fluctuation look worrying.
- CPU: Keep utilization visible; open the panel only when the Mac feels slow.
- RAM: Show percentage or memory pressure to tell whether an app is genuinely consuming too much memory.
- Network: Keep upload/download speed visible when downloading, syncing files, or troubleshooting a connection.
- Disk: Enable it when you need to watch SSD capacity or read/write activity.
The project also notes that continuously reading system data consumes resources. Sensors and Bluetooth are relatively more power-hungry, so there is no need to leave every module active if you only need CPU, RAM, and network information.
Conclusion
Stats does not replace Activity Monitor. It gives you a quick first look at what your Mac is doing without opening a window. The panels are clean, Traditional Chinese is available, and the default layout needs almost no setup.
If you often check CPU, RAM, network, or SSD status from the menu bar, start with brew install stats or download it from the official website. I would begin with just CPU, memory, and network modules, then add the rest only when they prove useful.